Voter Segmentation: Who lives in Ontario and how do they vote
Ontario's 124 ridings can be divided into multiple different voting groups—and each one has their own preference when it comes to who they want leading the province.
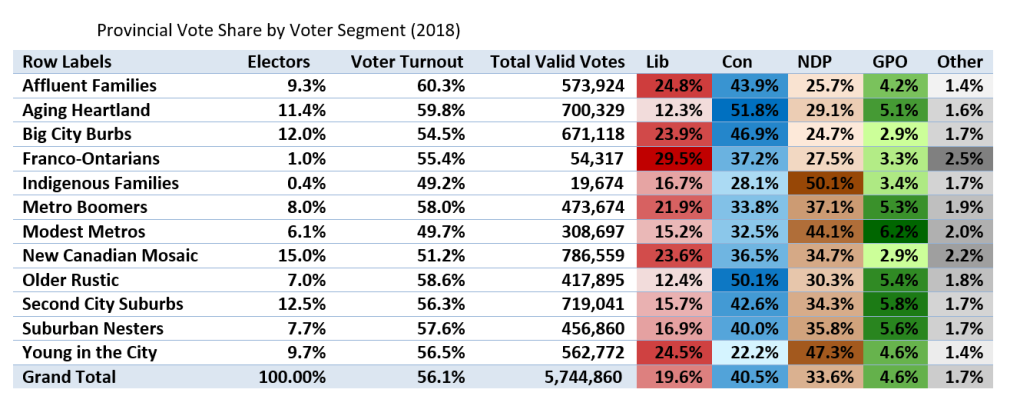
Data company Environics Analytics has broken down those key voting groups using a range of sources and modelling techniques to determine where they live, who they voted for in the 2018 election and how they may vote this time around.
A map showing what ridings these voting groups live in can be found here.
The estimates are determined by overlaying poll-level return data from Elections Ontario from the 2018 election with a range of other data points, including demographic, expenditure, psychographic, vaccination intention and movement data. It also takes overall riding characteristics and sentiment on important election issues into account.
Here's how Ontario's voters are divided:
Affluent Families
The wealthiest segment of voters in the province, Affluent Families typically have teenaged or college-aged children, or are empty-nest couples. They have a low debt-to-asset ratio and live in well-heeled urban and suburban neighbourhoods where the average home value is more than $1,000,000 or two times the provincial average in Q3 of 2021 Affluent Families represent 9.8 per cent of total eligible voters. They had the highest voter turnout (60 per cent) and tended to vote Progressive Conservative(PC) in the previous election.

Top 5 Ridings (by percent of eligible voters)
- Oakville
- Thornhill
- Orléans
- Mississauga—Lakeshore
- Oakville North—Burlington
Aging Heartland
Aging Heartland contains maturing families and empty-nest couples in Ontario’s rural communities. Voter turnout was relatively high, with just under 60 per cent casting a ballot in 2018. The rising cost of gas is likely to be on their minds as they tend to travel long distances in their vehicles. This was a decidedly PC segment, capturing a majority of votes (52 per cent) in this group. They represent 9.5 per cent of voters.

Top 5 Ridings (by percent of eligible voters)
- Huron—Bruce
- Lambton—Kent—Middlesex
- Perth—Wellington
- Essex
- Oxford
Big City Burbs
Big City Burbs is a collection of prosperous suburbs found throughout the Greater Toronto Area. The segment tends to contain well-established immigrants and second-generation professionals who are raising their children in fast-growing communities. In Ontario, they represent 12.2 per cent of voters and had below-average voter turnout at 54 per cent. They were highly sought after in the 2018 election and the PCs won this segment handily in the previous election. Big City Burbs tend to have higher expenditures for food, transportation, and entertainment when compared to the average Ontarian. These categories have experienced high inflation lately so Big City Burbs will feel the price increases more than average. This will be a segment to watch in this election as the third largest voter segment in Ontario.

Top 5 Ridings (by percent of eligible voters)
- Markham—Unionville
- Aurora—Oak Ridges—Richmond Hill
- Richmond Hill
- Scarborough—Agincourt
- Markham—Thornhill
New Canadian Mosaic
New Canadian Mosaic represents 15.7 per cent of voters as the largest voter segment in Ontario. These are middle to lower-middle income families that account for a significant portion of eligible voters in Brampton where there are large numbers of newcomers living in multi-generation households. The cost of housing is high for these Ontarians with rent taking proportionately a one-third larger share of household expenditures than average. Many in this segment say they are planning to purchase a home soonso housing affordability will be on their minds. This segment was competitive between the PCs and NDP in the last election with the PCs edging out the latter. With low voter turnout at 51 per cent, getting this group engaged could help some parties make gains.

Top 5 Ridings (by percent of eligible voters)
- Brampton East
- Brampton West
- Brampton North
- Brampton South
- Brampton Centre
Older Rustic
Older Rustic contains older, rural couples with modest incomes in Ontario and makes up 5.8 per cent of eligible voters. About 8 per cent are Indigenous. With the large number of vehicles they tend to own, they benefit greatly from the vehicle license fee rebates, but are feeling the pinch from the rising cost of gas given the large distances they drive annually. Half of this group voted PC in 2018 as they turned out at above-average rates (59 per cent).

Top 5 Ridings (by percent of eligible voters)
- Haliburton—Kawartha Lakes—Brock
- Parry Sound—Muskoka
- Timiskaming—Cochrane
- Renfrew—Nipissing—Pembroke
- Hastings—Lennox and Addington
Second City Suburbs
Middle and upper-middle income families gravitate to these suburban neighbourhoods in Ontario found outside of the GTA in suburban areas of Southwestern Ontario and Ottawa among others. Pocketbook issues are likely top-of-mind with Second City Suburbs as they have high debt-to-asset ratios and will feel the pinch from rising interest rates. This segment voted PC in the 2018 election and represents 12.8 per cent of voters with an average voter turnout of 56 per cent.

Top 5 Ridings (by percent of eligible voters)
- Barrie—Innisfil
- Durham
- Simcoe—Grey
- Dufferin—Caledon
- York—Simcoe
Young in the City
Young Ontarians starting their careers with good educations, enjoying once again the vibrant restaurants and cultural institutions found in Toronto neighbourhoods encapsulates this segment. They score highest of all on the Social Values Ecological Concern and Ecological Lifestyle which means they are more likely to prioritize environmental protection even at the expense of economic growth, and that they are more willing than average to pay a premium for goods and services that protect the environment. The NDP won Young in the City in 2018. This was the PCs’ worst-performing voter segment in Ontario. Young in the City represents 9.6 per cent of voters and had a voter turnout of 57 per cent which is close to the Ontario average.

Top 5 Ridings (by percent of eligible voters)
- Spadina—Fort York
- University—Rosedale
- Davenport
- Toronto—St. Paul's
- Toronto—Danforth
Indigenous Families
About two in three residents identify as Indigenous in these small-town and rural communities that make up 0.5 per cent of eligible voters. This segment includes most reserves across Ontario. A number of these families tend to comprise multi-generational households. Residents score very strongly on the Social Value Multiculturalism, which indicates support for preserving and embracing diversity of cultures and communities. Voter turnout was low at 49 per cent and party preference heavily favoured the NDP.

Top 5 Ridings (by percent of eligible voters)
- Kiiwetinoong
- Kenora—Rainy River
- Mushkegowuk—James Bay
- Thunder Bay—Superior North
- Algoma—Manitoulin
Suburban Nesters
The late-career and retired couples and singles living in Suburban Nesters surround mid-sized cities across Ontario. With middle to lower-middle incomes often derived from retirement savings and pensions, their low-debt lifestyles ensure they are comfortable, but mindful of pocketbook issues that affect them. Their turnout was just slightly above the Ontario average at 58 per cent. They voted PC in the last election but they are a force to be watched this time, as over a third voted for the NDP. Suburban Nesters make up 8.6 per cent of eligible voters in Ontario.

Top 5 Ridings (by percent of eligible voters)
- Peterborough—Kawartha
- Niagara Falls
- Northumberland—Peterborough South
- Kingston and the Islands
- Sault Ste. Marie
Modest Metros
A lower-income segment found in mid-sized cities outside of the GTA, Modest Metros tends to comprise younger singles and couples. About 6 per cent are Indigenous. With their modest incomes, rent eats up a disproportionately large share of their expenses and they are especially likely to feel the impact of inflation. Voter turnout was second-lowest of all segments in 2018 at 50 per cent. Modest Metros is a competitive segment for the NDP, perhaps with the potential to swing some seats if they can be mobilized as they make up 6.9 per cent of voters.

Top 5 Ridings (by percent of eligible voters)
- London—Fanshawe
- Hamilton Centre
- Oshawa
- Windsor West
- Brantford—Brant
Metro Boomers
Metro Boomers are middle-income urban seniors in medium-sized cities outside of the GTA. Among the issues on their minds, the environment could be one motivator; they score high for Social Values Ecological Concern which means they are more likely to believe that current environmental problems are a result of industrial and personal disregard for the environment. They make up 8.0 per cent of voters and voter turnout was high at 58 per cent. The NDP took this segment in 2018.

Top 5 Ridings (by percent of eligible voters)
- Burlington
- Oshawa
- Hamilton East—Stoney Creek
- Ottawa West—Nepean
- London West
Franco-Ontarians
Franco-Ontarians are lower to middle-income older singles and couples with 65 per cent of this group residing in the Glengarry—Prescott—Russell riding. Nearly half of this group speak French as their mother tongue. They represent 0.5 per cent of voters and had below-average voter turnout of 55 per cent in 2018. This group voted PC with the Liberals and NDP in a close race within this segment.

Top 5 Ridings (by percent of eligible voters)
- Glengarry—Prescott—Russell
- York South—Weston
- Orléans
- Ottawa—Vanier
- Eglinton—Lawrence
VOTER SEGMENTS
Voter segments provide insight into the voting preferences of different groups of Ontarians. This allows us to understand which broad groups of voters are present in different ridings, how they might tend to view certain issues, and how they voted in the 2018 provincial election. To create these segments, we proportionately attributed publicly available poll-level return data from Elections Ontario to the postal codes covered by each poll. Then we overlayed EA’s PRIZM data to create 12 voter segments that group together the 67 PRIZMs that tend to have similar demographics and regional voting behaviours. Note that these segments are based on postal code and riding data, not individual data, so the names and escryiptions of each segment are intended to capture the predominant characteristics of each segment as a whole. Individual voters may or may not fit the segment’s characterization.
If you have questions about the data or methodology, click here.
Shopping Trends
The Shopping Trends team is independent of the journalists at CTV News. We may earn a commission when you use our links to shop. Read about us.


CTVNews.ca Top Stories

opinion
opinion Tom Mulcair: Prime Minister Justin Trudeau's train wreck of a final act
In his latest column for CTVNews.ca, former NDP leader and political analyst Tom Mulcair puts a spotlight on the 'spectacular failure' of Prime Minister Justin Trudeau's final act on the political stage.
B.C. mayor gets calls from across Canada about 'crazy' plan to recruit doctors
A British Columbia community's "out-of-the-box" plan to ease its family doctor shortage by hiring physicians as city employees is sparking interest from across Canada, says Colwood Mayor Doug Kobayashi.
'There’s no support': Domestic abuse survivor shares difficulties leaving her relationship
An Edmonton woman who tried to flee an abusive relationship ended up back where she started in part due to a lack of shelter space.
opinion
opinion King Charles' Christmas: Who's in and who's out this year?
Christmas 2024 is set to be a Christmas like no other for the Royal Family, says royal commentator Afua Hagan. King Charles III has initiated the most important and significant transformation of royal Christmas celebrations in decades.
Baseball Hall of Famer Rickey Henderson dead at 65, reports say
Rickey Henderson, a Baseball Hall of Famer and Major League Baseball’s all-time stolen bases leader, is dead at 65, according to multiple reports.
Arizona third-grader saves choking friend
An Arizona third-grader is being recognized by his local fire department after saving a friend from choking.
Germans mourn the 5 killed and 200 injured in the apparent attack on a Christmas market
Germans on Saturday mourned the victims of an apparent attack in which authorities say a doctor drove into a busy outdoor Christmas market, killing five people, injuring 200 others and shaking the public’s sense of security at what would otherwise be a time of joy.
Blake Lively accuses 'It Ends With Us' director Justin Baldoni of harassment and smear campaign
Blake Lively has accused her 'It Ends With Us' director and co-star Justin Baldoni of sexual harassment on the set of the movie and a subsequent effort to “destroy' her reputation in a legal complaint.
Oysters distributed in B.C., Alberta, Ontario recalled for norovirus contamination
The Canadian Food Inspection Agency has issued a recall due to possible norovirus contamination of certain oysters distributed in British Columbia, Alberta and Ontario.
Montreal
-

Major factory fire in the Maskinonge, Que.
A major fire devastated an industrial building in the municipality Maskinongé, Que on Saturday.
-
West Island clinic set to close at the end of December
Statcare Emergency Clinic in Pointe-Claire will shut its doors on Dec. 31.
-
Here's how you can watch CTV News Montreal at Six on Saturday during the NFL season
With CTV broadcasting NFL football games on Saturdays this season, CTV News Montreal at Six will be broadcasting live on our website and the CTV News App.
Ottawa
-

Ottawa Senators fans, organization embracing 'mullet man' mascot
Gatineau-based Ottawa Senators Jay Trepanier has been dubbed the "mullet man" after his flowing haircut caught the attention of the television cameras during a game in October.
-
What's open and closed in Ottawa over the holidays
CTVNewsOttawa.ca takes a look at what's open and closed over the Christmas and New Year's holidays this year.
-
Ottawa MP Mona Fortier appointed chief government whip
Ottawa-Vanier MP Mona Fortier has been appointed as chief government whip, the latest addition in a major reshuffle of Prime Minister Justin Trudeau's cabinet.
Northern Ontario
-

Robinson Superior First Nations provided settlement offer from Canada over annuities owed
Details haven’t been made public yet about the settlement offer presented on Friday by Canada to the 12 First Nations in the Robinson Superior Treaty Territory.
-
Northern Ont. man illegally killed three moose, one deer
A man from the northwestern Ontario community of Dinorwic has been found guilty of multiple hunting offences and fined $6,500, banned from hunting for five years and placed on probation for 18 months.
-
opinion
opinion Tom Mulcair: Prime Minister Justin Trudeau's train wreck of a final act
In his latest column for CTVNews.ca, former NDP leader and political analyst Tom Mulcair puts a spotlight on the 'spectacular failure' of Prime Minister Justin Trudeau's final act on the political stage.
Kitchener
-

'I'm still thinking pinch me': lost puppy reunited with family after five years
After almost five years of searching and never giving up hope, the Tuffin family received the best Christmas gift they could have hoped for: being reunited with their long-lost puppy.
-
Impaired driver causes significant delays on Waterloo highway
A 24-year-old man is facing charges after driving while drunk across two Waterloo Regional highways on Friday.
-
Fire destroys home in Haldimand County
A home in Haldimand County has been destroyed after a Saturday afternoon fire.
London
-

New Canadians displaced after fire destroys east London townhome
A family of new Canadians from Nigeria are looking for a new home just before Christmas. Fire destroyed their townhome on Bentley Drive in northeast London, Ont. Friday night.
-
Feeling Festive? Check out this display of over 300 lit Christmas trees
“We have over 300 Christmas trees on display, the majority of them are sponsored and decorated by all of our amazing local businesses,” says Ashley Mason, event and hospitality manager at CASO Station and ECRM in St. Thomas, Ont.
-
Sarnia Police Auxiliary Unit works to return stolen shopping carts to businesses
The high cost of crime is often passed on to consumers – whether it’s shoplifting, vandalism or property damage.
Windsor
-

Former workers of 'one-of-a-kind' entertainment hub reunite
Former employees of the Elmwood Casino gathered outside their old stomping grounds Saturday, exactly 50 years after the prominent Windsor joint shut its doors.
-
'Heartwarming': Windsor-Essex families receive help filling underneath the tree
Space under the Christmas tree became far more limited for several Windsor-Essex families who received a visit from volunteers at Project Christmas.
-
'It's got to stop, it's that simple': Windsor cab drivers warn of unregulated operators
Drivers now compete with individuals using social media to advertise rides at cut-rate prices. One person offers $10 rides within the city, while another promotes daily trips from Windsor to Toronto for $45 per person.
Barrie
-

One driver faces several charges following Highway 400 crash in Oro-Medonte
Traffic came to a standstill Friday afternoon following a single-vehicle collision on Highway 400 in Oro-Medonte.
-
High school teacher charged with sexual assault amid allegations involving a student
A 51-year-old teacher from Georgina has been charged with sexual assault following allegations involving a student.
-
Hospice Simcoe mourns loss of COPE service pup, after 7.5 years of service
The Hospice Simcoe community is mourning the loss of their Canine Opportunity, People Empowerment (COPE) service dog, Daisy.
Winnipeg
-

Residential parking ban lifted in Winnipeg
The City of Winnipeg has lifted its parking ban on residential streets, which means its winter route ban is back in effect.
-
Bail denied for Winnipeg woman accused of killing animals in online videos
Warning: This story contains disturbing details. Discretion is advised. A Winnipeg woman accused of making videos of animals being tortured and killed that were sold on the dark web was denied bail.
-
Ace Burpee's Top 100 Most Fascinating Manitobans of 2024
It’s been another year of Manitobans doing interesting, incredible and cool things. The hardest part of compiling this list is cutting it off at 100.
Atlantic
-

Cancellations, closures accompany Maritime storm
There are a number of closures in the Maritimes Saturday after a nor'easter brought heavy snow to parts of the region.
-
Calling all bloodhounds: These P.E.I. blood donors have four legs and a tail
Dogs are donating blood and saving the lives of canines at the University of Prince Edward Island's Atlantic Veterinary College in Charlottetown.
-
Youth dies following accident in Moncton, N.B.
RCMP in Moncton, N.B., said one of two passengers, a youth, involved in an accident on Monday, has died in hospital as a result of his injuries.
N.L.
-

Newfoundland woman washed sick patients' hair every Saturday for more than 20 years
A retired nurse and teacher in Newfoundland was honoured this week for her volunteer work, which included more than two decades washing the hair of bedridden hospital patients.
-
Newfoundland man facing more charges related to youth sex crimes
A 64-year-old Newfoundland man charged with dozens of sex crimes involving young people is facing several new charges.
-
After fanfare of Churchill Falls deal, Newfoundland urged to learn its dam lessons
Energy observers in Newfoundland and Labrador are urging the provincial government to take a sober second look at a massive tentative deal announced last week with Quebec that promises to deliver hundreds of billions of dollars in revenue to the Atlantic province.
Edmonton
-

'There’s no support': Domestic abuse survivor shares difficulties leaving her relationship
An Edmonton woman who tried to flee an abusive relationship ended up back where she started in part due to a lack of shelter space.
-
Icy conditions: Alberta RCMP warn of poor driving conditions on QEII between Leduc and Red Deer
Alberta RCMP issued a warning to drivers Saturday morning about slick conditions on the QEII between Leduc and Red Deer.
-
Heavy police presence in south Fort McMurray: RCMP
RCMP warned Fort McMurray residents Saturday night about an unfolding police incident in Beacon Hill.
Calgary
-

'This shouldn't happen': Calgary family seeks changes after WestJet accessibility incident
A Calgary woman wants WestJet to apologize to her daughter and to improve staff training on accessibility after an incident during their latest trip.
-
Promise of high-level hockey comes at a cost for prep school players at Circle K Classic
Calgary is set to host the Circle K Classic, welcoming some high-end talent and pricey prep schools for the annual U18 AAA hockey tournament.
-
Flames get goals from 6 players in a 6-4 victory over the Blackhawks
Jonathan Huberdeau, Connor Zary, Blake Coleman, and Matt Coronato each had a goal and an assist as the Calgary Flames beat the Chicago Blackhawks 6-4 on Saturday.
Regina
-

Gathering held in Regina to recognize Winter Solstice
Regina's mâmawêyatitân centre held a day of gathering for the Winter Solstice on Saturday.
-
Canada's first sustainable Tim Hortons location to open in Regina this weekend
Canada’s first sustainable Tim Hortons opens in Regina this weekend. The restaurant, located in the city’s east end, features design and operating features that minimize environmental impact.
-
Gravelbourg's transportation program celebrates addition of new vehicle and garage
The town of Gravelbourg is celebrating the addition of a new vehicle and garage which will be used in their local transportation program.
Saskatoon
-

Sask. police investigating mischief incident after bomb report in school
Prince Albert police are investigating a mischief incident after a bomb report in a school Friday afternoon.
-
Prince Albert woman collects donations to make Christmas hampers for community
A Prince Albert woman is spreading holiday cheer by organizing Christmas hampers for those in need.
-
Sask. lawyers defend judge for staying fatal THC-impaired driving charge
The Saskatchewan Trial Lawyers Association is defending a provincial court judge, who’s facing backlash for staying a charge in a high-profile case involving the death of a child.
Vancouver
-

Man wounded in Mission, B.C., shooting
One man was injured in a shooting in the Lower Mainland city of Mission Saturday morning, Mounties confirmed.
-
Winds exceeding 120 km/h reported in parts of B.C. coast
Residents of parts of the British Columbia coast are again bracing for high winds, with gusts forecasted to reach 110 km/h in some areas.
-
2 dead after car crash in Burnaby
Two people were killed in a car crash in Burnaby early Saturday morning, police confirmed.
Vancouver Island
-

B.C. mayor gets calls from across Canada about 'crazy' plan to recruit doctors
A British Columbia community's "out-of-the-box" plan to ease its family doctor shortage by hiring physicians as city employees is sparking interest from across Canada, says Colwood Mayor Doug Kobayashi.
-
B.C. woman with photographic memory strives to make unforgettable Christmas displays
Although Alisha Pauling is looking through old pictures, she doesn’t need them to remember her Christmases past. She has a photographic memory.
-
Internet stranger's kind gesture restores Canucks fan's faith in humanity
A Nanaimo, B.C., couple is in awe at the kindness of an internet stranger who helped them track down a coveted Christmas gift.